<body><script type="text/javascript"> function setAttributeOnload(object, attribute, val) { if(window.addEventListener) { window.addEventListener('load', function(){ object[attribute] = val; }, false); } else { window.attachEvent('onload', function(){ object[attribute] = val; }); } } </script> <div id="navbar-iframe-container"></div> <script type="text/javascript" src="https://apis.google.com/js/plusone.js"></script> <script type="text/javascript"> gapi.load("iframes-styles-bubble", function() { if (window.iframes && iframes.open) { iframes.open( '//www.blogger.com/navbar.g?targetBlogID\07512048943\46blogName\75Friar+Faithful\46publishMode\75PUBLISH_MODE_BLOGSPOT\46navbarType\75BLUE\46layoutType\75CLASSIC\46searchRoot\75http://sdpf.blogspot.com/search\46blogLocale\75en_US\46v\0752\46homepageUrl\75http://sdpf.blogspot.com/\46vt\75-6412724678078685403', { container: "navbar-iframe-container", id: "navbar-iframe" }, { }); } }); </script>

Friday, August 19, 2005

NL West Race (Graph)

Title Track

Image hosted by Photobucket.com

2 Comments:

Blogger Lance Richardson said...

I can't tell you how much I hate graphs. I've always felt that a person who needs a graph to understand data is a lower-level primate who hasn't a clue what the data represents, anyway. But that's just me.
What I really mean is, graphs are for monkeys.

7:21 PM, August 22, 2005  
Blogger Richard B. Wade said...

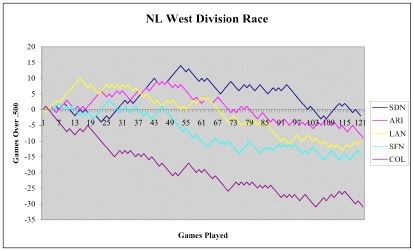
It would take a lot more space to show the data that this graph shows. I can upload the table, if you like.

4:05 PM, August 23, 2005  

Post a Comment

Links to this post:

Create a Link

<< Home