

No Weaknesses? No Way.
Title Track
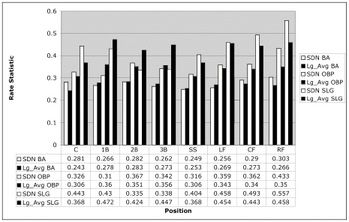
An article in the Union Tribune today said that the Padres lack any major weaknesses and that we shouldn't expect a trade. I found it unlikely, so I looked up the Padres BA/OBP/SLG by position and then compared it to the League Average at each position. I'm already confident that the rotation and bullpen are well above league average (see my BtB post).
San Diego is above league average of all three rate statistics at Catcher, Center Field and Right Field. We are also above league average for OBP/SLG at Short Stop & Left Field.
At First and Third Base, San Diego is below league average for all three rate statisitcs. In case you're wondering, Geoff Blum isn't the answer to the Padres' lack of production at third.
At second base, we have an OBP .016 over league average, but that fails to make up for the .089 deficit in slugging percentage.
Nothing earth-shattering, but there's an ugly chart still in production. Check back for an ugly chart.
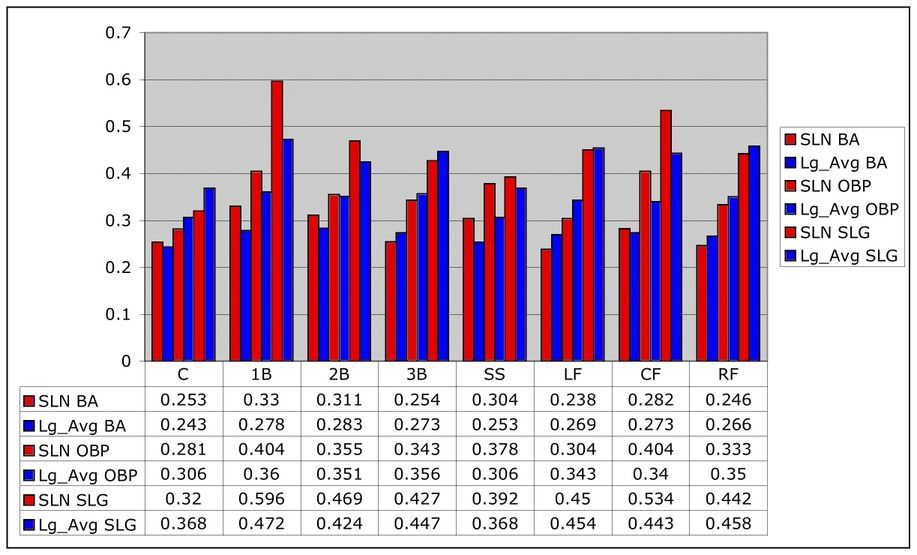
Update: I finished the chart. PowerPoint insisted on using six different colors, so I "fixed" the chart in Graphic Converter. Oh, and a version of the chart that's big enough to read is available here. And now for comparison's sake, you can see the Cardinals' lineup given the same treatment only with blinding red and blue instead of black and white here.
An article in the Union Tribune today said that the Padres lack any major weaknesses and that we shouldn't expect a trade. I found it unlikely, so I looked up the Padres BA/OBP/SLG by position and then compared it to the League Average at each position. I'm already confident that the rotation and bullpen are well above league average (see my BtB post).
San Diego is above league average of all three rate statistics at Catcher, Center Field and Right Field. We are also above league average for OBP/SLG at Short Stop & Left Field.
At First and Third Base, San Diego is below league average for all three rate statisitcs. In case you're wondering, Geoff Blum isn't the answer to the Padres' lack of production at third.
At second base, we have an OBP .016 over league average, but that fails to make up for the .089 deficit in slugging percentage.
Nothing earth-shattering, but there's an ugly chart still in production. Check back for an ugly chart.
Update: I finished the chart. PowerPoint insisted on using six different colors, so I "fixed" the chart in Graphic Converter. Oh, and a version of the chart that's big enough to read is available here. And now for comparison's sake, you can see the Cardinals' lineup given the same treatment only with blinding red and blue instead of black and white here.
posted by Richard B. Wade at 4:49 PM
![]()
![]()
8 Comments:
While it is a small sample size, Blum is posting a .310/.400/.500 line as a 3B this year. Burroughs, not Blum, is the one bringing the 3B numbers down.
My point was not that Burroughs has been better than Blum. Rather my point was that Blum's numbers this year do not compare favorably to a league average third baseman.
You wrote:
"In case you're wondering, Geoff Blum isn't the answer to the Padres' lack of production at third."
So your point was specific to Blum's production at third. This year, Blum is the answer to offensive production at third. His numbers improved yet again tonight.
Sometimes, a player is more comfortable at a certain position and his offensive numbers reflect that. 3B is Blum's best position and it shows in his splits.
Good point, Dex. I actually did that comparison earlier this year. I do believe the comparison by position is reasonable, though. Even if you go by lineup position, different teams may ask different things of their #2 hitter (for instance) than another team.
In about 60 PA at 3B, Blum is posting a .353/.433/.608 line. Among NL 3B with 50+ PA, only Wilson Betemit has a higher OPS, at 1.048. Among regular NL 3B, Chipper Jones is posting the highest OPS at the position (.987).
"Geoff Blum [currently] is[] the answer to the Padres' lack of production at third."
:)
You can't look exclusively at his batting numbers while playing third base. You have to account for all of his numbers.
Of course you can. In fact, for purposes of your analysis, you must if your chart is to have any relevance. Your chart is looking at stats by position, so your previous comment is logically self-defeating.
Blum's stats at 3B are including in the 3B portion. His poor offensive stats at 2B help to suppress an otherwise higher OBP and SLG by Loretta at 2B.
Even if I were to agree with your position that you look at all numbers, here is Blum's current line.
.296/.354/.461/.815
It is above average in all categories for 2B and SS, and overall above average for 3B.
I appreciate the work you do in these graphs, but there is no harm in refining your analysis.
It's worth noting that Blum's numbers have improved since we began discussing this. That being said, the point of the graph was to look at the production the Padres have gotten from the various positions relative to the league average of the various positions. My other point was that neither Blum nor Burroughs is putting up numbers comparable to a league average third baseman. That Blum's numbers while playing third base are above league average does not suggest otherwise. Given more playing time, his numbers as a third baseman should regress toward his overall numbers. What you consider proof that he is an above average third baseman is no more than proof that small sample sizes are deceptive.
I appreciate your commentary and am pleased to see that Blummer is currently playing outside himself (or maybe it's the change to his swing?) as it's good for the team.
Post a Comment
<< Home